|
Provincial Landscape Viewer |
|
|
Questions and/or comments about the Provincial Landscape Viewer may be submitted directly using this email link. geoinfo@novascotia.ca |
Help |

Ecological Land Classification
Locate by Address or Coordinates
Provincial Landscape Viewer
About the Viewer
The Provincial Landscape Viewer is a mapping tool developed by the Nova Scotia Department of Natural Resources (DNR) to provide easy access to ecological landscape data, along with forestry and wildlife information for natural resource planning and management.
NOTE: Data projection is WGS84 Web Mercator (Auxiliary Sphere).
Disclaimer |
|
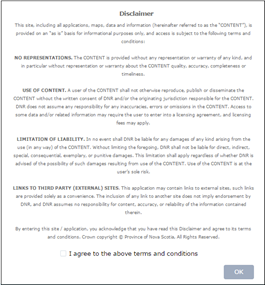
When the user first enters the site, the Disclaimer will be presented. By clicking “Acknowledge”, the user accepts the use of the web site with the terms and conditions as set out in the disclaimer. |
Screen Overview |
|
Once the user acknowledges the Disclaimer screen, the site will open with the Province of Nova Scotia centered within the window.
The image at left shows the main components of the viewer and identifies the key functions and features available to the user. |
|
|
|
|
Identify |
|
At any time, you can click on any feature on the map to display attribute information for the selected feature. The outline of the selected feature will be highlighted and a small window will display the relevant attributes.
Click the
arrow icon
|

Left Widget Tool Bar
Navigation
|
|
|
|||||||||||
Layer List
|
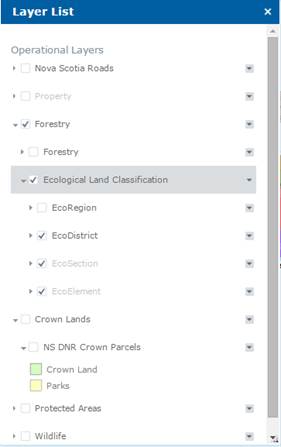
Not all layers are visible at all zoom levels. Some layers are scale dependant and will turn on or off depending on the display scale of the map. Layers that are available for display at the current scale will appear in darker text. Layers that cannot be displayed at the current scale will appear in fainter text.
You can expand or collapse the Layer groups by clicking anywhere on the layer group name. You can also see the legend for a layer when it is expanded to its lowest level, as shown for the NS DNR Crown Parcels layer in this image.
|
|
|||||||||||
|
Layer Transparency |
|
|
|||||||||||
 The
layers shown in the Layer List are available for display by clicking the
check box next to the layer you wish to see. Individual layers, or all
layers in a layer group (e.g. Ecological Land Classification) can be turned
on or off this way.
The
layers shown in the Layer List are available for display by clicking the
check box next to the layer you wish to see. Individual layers, or all
layers in a layer group (e.g. Ecological Land Classification) can be turned
on or off this way. In
the Layer List, click the down arrow on the far right of any top-level layer
group (highlighted at right) and choose Transperancy to display a slider
bar. Move the slider arrow from Opaque to Transparent to make the layer(s)
more transparent. This will allow you to see the information for multiple
layers and/or the underlying base layer, as needed.
In
the Layer List, click the down arrow on the far right of any top-level layer
group (highlighted at right) and choose Transperancy to display a slider
bar. Move the slider arrow from Opaque to Transparent to make the layer(s)
more transparent. This will allow you to see the information for multiple
layers and/or the underlying base layer, as needed.The data layers available in the Provincial Landscape Viewer are listed below.
|
Layer Name |
Description |
NS Roads |
Displays the Nova Scotia road network simplified. |
Forestry |
Forestry layers grouping |
|
Old Forest Policy |
The old forest layer maps the locations of stands that were selected under the Interim Old Forest Policy of 1999 (novascotia.ca/natr/library/forestry/reports/Old-Forest-Policy-2012.pdf). The forests identified in the layer consist of old growth stands, as well as mature stands set aside to restore old growth. According to the policy these stands will be maintained and left to mature naturally with no management intervention. Most of the forests in this layer are not old growth. The majority are mature climax stands that provide good opportunities for long-term old growth restoration. They were selected following the Procedures in the Interim Old Forest Policy. True old growth forests are uncommon, and make up only a small proportion of the stands in this layer. The location of all old growth in the Province is unknown, however DNR maintains a registry of old stands that have been evaluated using DNR's Old Forest Scoring system (novascotia.ca/natr/forestry/programs/ecosystems/scoresht.asp). The 2008 report "Implementation of Nova Scotia Interim Old Forest Policy for Crown Land - A Status Report" provides a summary of the forest stands contained within the old forest layer. (novascotia.ca/natr/library/forestry/reports/state-of-forest-old-growth.pdf). |
|
Forest Treatment Overview |
This layer provides an overview of the location and type of silviculture treatments in the forest. Sources of information include: GPS collected data submitted under the Wood Acquisition Plan program, Crown land silviculture data collected from various sources, including paper plans, string box and compass, aerial photography and GPS and historical pre-GPS silvicultural features. |
|
Forest Treatment Details |
The treatment details layer records the location and type of silviculture treatments in the forest. Sources of information include: GPS collected data submitted under the Wood Acquisition Plan program, Crown land silviculture data collected from various sources, including paper plans, string box and compass, aerial photography and GPS and historical pre-GPS silvicultural features. Note that all treatments are not recorded. For example, it is known that not all treatments on private land are reported to the Wood Acquisition Plan program. |
|
Forest Stand Details |
This layer delineates forest stands and non-forest areas. At large scales, labels show some stand attributes. |
|
Leading Forest Species |
This layer identifies the leading forest species. |
|
Land Cover |
Identifies forest cover types, including non-forest categories. |
|
Forest Height |
This layer displays the average forest stand height categories for the main forest story. |
|
Forest Volume |
Identifies the average total merchantable volume categories (m3/ha) for forest stands. |
|
WAM Predicted Flow |
This is a line thematic layer for predicted/unmapped/ephemeral streams (surface and subsurface drainage) in Nova Scotia, as created through the flow accumulation sub-process of the Wet Areas Mapping (WAM) project. The predicted polyline features mimic mapped stream paths, and extend beyond the mapped endpoints to include unmapped channels. A minimum threshold drainage area of four (4) hectares was used. The project was completed under contract by the Nexfor/Bowater Forest Watershed Research Centre at the University of New Brunswick. For more information, refer to novascotia.ca/natr/forestry/gis/wamdownload.asp. |
|
WAM Wetness Index |
Provincial Wet Areas Mapping (WAM) is the product of research work carried out by the Nexfor/Bowater Forest Watershed Research Centre at the University of New Brunswick (led by Dr. Paul Arp). This project was funded by several government and industry partners. The WAM model predicts where water will naturally flow and/or accumulate in the landscape based on digital elevation (DEM) data and the known location of surface water bodies and wetlands. In essence, WAM is a "cartographically derived depth-to-water index." It is important for users of WAM to understand that depth values listed do not represent predicted depth to a water table or ground water, rather they are a relative wetness index which can be related to the likelihood of there being natural water flows (above or below ground) and accumulation of water as reflected by on-site drainage conditions (well, moderately well, imperfect, poor, very poor). WAM does not take into account soil conditions that may further influence drainage conditions (such as soil texture), nor does it predict flows and accumulations that are the result of human disturbance or infrastructure. The WAM project was completed under contract by the University of New Brunswick in 2005-2007. For more information, refer to novascotia.ca/natr/forestry/gis/wamdownload.asp. |
|
Road Index |
This data layer is an integer raster generated from the weighted density of all transportation features surrounding a cell (pixel) and the distance to the closest transportation feature. Values range between 1-100, with higher values representing urbanized landscapes and lower values representing remote undeveloped landscapes. The density and distance measures are calculated using a one kilometer radius analysis window and assigned to a 1 hectare cell. Transportation features are derived from the Nova Scotia Topographic Database augmented with road features visually delineated from Landsat satellite imagery. |
|
Seral Stage |
Any stage of succession of an ecosystem from a disturbed, non-vegetated state to a climax plant community. Seral Stage describes the tree species composition of a forest within the context of successional development. As succession advances, the forest changes from being virtually 100% early successional trees to almost 100% climax tree species. Responding to this development, animals and understory plant species gradually change proportions too. This Inventory attempts to measure this ecological process by assigning a successional score based on a tree species’ successional level and multiplying by the tree species’ percentage in the stand.
A look-up table assigns each species in the GIS a value from 1 to 5 for its position on the successional scale. For example red spruce (RS) is given a value of 5 while intolerant hardwood (IH) has a value of 1. The look-up table may change by ecodistrict since climax on the coast or the Cape Breton Highlands differs from inland and lowland districts.
This successional value is multiplied by the species’ percent in the stand to give a stand successional score. Each stand may have up to four species, and the four percentages should add to 10, so the stand successional scores should range from 10 to 50. These scores are subdivided into three successional categories: 10 - 23 early, 24 - 37 mid and 38 - 50 late. |
|
Development Class |
Development class indicators describe changes in structure and process as forests age and trees grow larger. Previous Ecological Landscape Analysis reported development class by height. Moving forward, the ELA updates will report on development class by age.
For landscape management purposes, these development classes are recognized:
· Forest establishment development class (0–25 yrs) is the establishment of new growth following a stand-initiating disturbance. It consists of high diversity of mostly short-lived shade intolerant “pioneer” species.
· Young forest development class (26–40 yrs) consists of developing tree canopies characterized by vigorous self-thinning, crown differentiation and no understory development.
· Mature forest development class (41–120 yrs) consists of stands dominated by upper canopy with full differentiation into dominance classes. Individual tree mortality creates canopy gaps that are soon closed by neighbouring tree growth and increased light initiates regeneration and early understory development. Mature forests are broken up into two developmental age classes: early and late. Early mature are forests between the ages of 41 and 80 years old. Late mature are between the ages of 81 and 120 years old.
· Multi-aged development class (> 3 height layers = multi-aged, classified as > 120 years old) is dominated by an overstory exhibiting a variety of crown sizes and canopy densities. It contains canopy gaps that promote development of multi-layered understory and recruitment to the overstory and are typically old forests. |
|
Forest Modelling Elements |
This is a coarse characterization of the occurrence and relative abundance of tree species associations within the forested landscape and is built upon the Nova Scotia Forest Inventory. The focus is on dominant tree species associations. The Ecological Landscape Analysis guide outlines twelve forest communities: HTHw, HITHw, HIHw, MTHw, MIHwHS, MIHwSH, SrSbSDom, SwSDom, SbFDom, SSpbFDom, SPiDom, SMHePiSP. As well, there are five classes to represent non-forest inventory types: ILW, AV, ANV, NNV, and NFV. |
|
Dominant Natural Disturbance |
Dominant natural disturbance regime (NDR) an interpreted layer contained in the Ecological Landscape Classification for Nova Scotia. It represents the patterns (frequency, intensity and extent) of fire, insects, wind, landslides and other natural processes in an area at the EcoSection level (Mapping Nova Scotia’s Natural Disturbance Regimes). Natural disturbances inherently influence the arrangement of forested ecosystems and their biodiversity on a given landscape. Three disturbance regimes recognized in Nova Scotia are: · Frequent: Disturbances which result in the rapid mortality of an existing stand and the establishment of a new stand of relatively even age. The time interval between stand initiating events typically occurs more frequently than the longevity of the climax species that would occupy the site – therefore, evidence of gap dynamics and understory recruitment is usually absent. This regime results in the establishment and perpetuation of early to mid-successional vegetation types.
· Infrequent: Stand initiating disturbances which result in the rapid mortality of an existing stand and the establishment of a new stand of relatively even-age, but the time interval between disturbance events is normally longer than the average longevity of the dominant species – allowing gap dynamics and understory recruitment to evolve and become evident (eventually creating uneven-aged stands). This regime generally leads to the establishment and/or perpetuation of mid to late successional vegetation types.
· Gap replacement: Stand initiating disturbances are rare. Instead, disturbances are characterized by gap and small patch mortality, followed by understory recruitment, resulting in stands with multiple age classes. This regime generally leads to establishment and/or perpetuation of late successional vegetation types. |
|
Ecological Emphasis Class |
Four levels of conservation are defined based on the degree to which the conservation of natural conditions is emphasized in the management practices and policies applied to the land. All lands are assessed at the stand level of the GIS forestry database layer, and assigned to one of the four ecological emphasis classes. |
Ecological Land Classification |
Ecological Land Classification layers grouping. For more detailed information on the DNR Ecological Land Classification system, refer to Ecological Land Classification For Nova Scotia - Revised Edition 2005. |
|
EcoRegion |
The second level of the Ecological Land Classification for Nova Scotia, and a subdivision of ecozone. Used to characterize distinctive regional climate as expressed by vegetation. There are nine ecoregions identified in Nova Scotia. |
|
EcoDistrict |
The third of five levels in the Ecological Land Classification for Nova Scotia, and a subdivision of ecoregions. Characterized by distinctive assemblages of relief, geology, landform and vegetation. |
|
EcoSection |
The fourth of five levels in the Ecological Land Classification for Nova Scotia, and a subdivision of ecodistricts. An ecological land unit with a repeating pattern of landform, soils, and vegetation throughout an ecodistrict. |
|
EcoElement |
A landscape ecosystem containing characteristic site conditions that support similar potential vegetation and successional processes. Elements were mapped by combining ecosections with similar climax vegetation and natural disturbance interpretations. |
Crown Lands |
Crown land parcels, administered by the Nova Scotia Department of Natural Resources. For more information on Crown land, refer to novascotia.ca/natr/land/ |
Protected Areas |
Wilderness Areas and Nature Reserves under the administration of Nova Scotia Environment. For more detailed information on Nova Scotia’s protected areas, refer to novascotia.ca/parksandprotectedareas/ |
Wildlife |
Wildlife layers grouping |
|
Deer and Moose Zones |
Deer and Moose Zones layer grouping |
|
Deer Zones |
Identifies the Department of Natural Resources deer management zones in Nova Scotia. More information on deer management zones can be found here: http://novascotia.ca/natr/wildlife/sustainable/deermgt.asp |
|
Moose Zones |
Identifies the Department of Natural Resources moose management zones in Nova Scotia (only on Cape Breton Island). Information on moose management zones can be found here: http://novascotia.ca/natr/draws/moosedraw/mmzones.asp |
|
Wetlands |
Wetlands layer grouping. For more information on wetlands, see novascotia.ca/natr/wildlife/habitats/wetlands.asp |
|
Wetlands |
This product was developed to classify the wetlands in the Nova Scotia Wetlands and Coastal Habitats Inventory (2000) into vegetation types and then to roll up the vegetation into the 5 wetland classes recognized by the Canadian Wetlands Inventory (open water, marsh, swamp, bog, fen,). The initial wetlands based on air photo interpretation were used as polygon boundaries for the generation of a new dataset based on Landsat 7 TM imagery. The Landsat imagery was segmented into objects (groups of related pixels). These objects were classified into vegetation types within the wetland boundaries and then rolled up into wetland classes (open water, marsh, swamp, bog, fen, bog or fen).This provided a way to update any changes that occurred in the wetland polygon after the initial inventory based on airphoto interpretation. Note that not all wetlands within the province have been captured, and some areas that have been identified as wetlands, may not be wetlands. |
|
Vegetation |
The classified vegetation communities within the wetland boundaries of the Province of Nova Scotia. |
|
Special Management Practice Zones |
Special Management Practice Zones layer grouping |
|
Atlantic Coastal Plain Flora Buffers |
The Atlantic Coastal Plain Flora (ACPF) Recovery Strategy and Management Plan identified 42 priority ACPF species (ranked as red, orange, yellow, and undetermined). These species locations were extracted from the Atlantic Canada Conservation Centre database and buffers placed around them. This buffered layer provides a special management zone adjacent to priority Atlantic Coastal Plain Flora (ACPF) habitats and can be used in wood supply analysis and as a tool for other improved decision-making and planning processes. It includes much of the important habitat areas for ACPF. Note the limits of this coarse-filter mapping approach, not all priority ACPF habitat will be captured by the data, conversely, the data may include areas of habitat that may not support ACPF. If more detailed information is required, other data sources, consultation with experts, and/or field surveys, may be required.
The species locations were buffered by 100 metres, as well any lake which had a point within 100 metres was buffered 100 metres. When there were buffers within 100 metres of each other, the buffers were joined. When along a river/stream and there were groups of buffers, if there was greater than 100 metres between groups but less than 600 metres, the buffers were joined. |
|
Lynx Buffer |
The Canada lynx (Lynx canadensis) in Nova Scotia was designated endangered in 2002 under the Nova Scotia Endangered Species Act. A breeding population of lynx exists only on Cape Breton Island. As a part of the recovery effort, it has been suggested to leave a 100 metre buffer of undisturbed forest around all bogs. Highland bogs tend to be temporally stable and are reliable producers of cone crops. It is hoped that these areas will supplement red squirrel habitat (one of the lynx’s food source). These lynx habitat buffers provide a special management zones and can be included in wood supply analysis and as a tool for other improved decision-making and planning processes. More information can be found here: novascotia.ca/natr/wildlife/habitats/terrestrial/pdf/SMP_Canada_Lynx.pdf
In order to create this habitat buffer, polygons in the Forest database with a fornon code of 72 (Open Bog and Fen) and 73 (Treed Bog and Fen) were selected, as well as the bogs from the fornon 70 (Wetlands General). (The wetlands in the wetlands inventory with the fornon of 70 which had 50% or more bog class in the wetland type codes were selected.) The wetlands within the Wilderness Areas and Cape Breton Highlands National Park were removed, and the remaining selected wetland polygons were buffered by 100 metres. |
|
Marten Range Patches 2019 |
Within the Marten Habitat Management Zone (MHMZ), forecasting forest development on a stand-by-stand until year 2030 produced a series of marten habitat map layers for 2004, 2009, 2014, 2019, and 2030 used to identify and plan for 55 prescribed marten home range patches by 2030. While not all of the required patches were initially available within the MHMZ, particularly in the first 3 time periods, by the year 2030 the options to create quality marten habitat patches will increase significantly if the Special Management Practices (SMPs) are adhered to. Home range patches may migrate within the MHMZ but must be a minimum 500 ha in size, circular in shape, and contain a minimum 60% marten habitat. There were 30 patches forecasted for the year 2019
Stand volumes were grown according to the Department of Natural Resources forest inventory site classification system used in Nova Scotia. Stand heights were forecasted based the site class of the stand, and a maximum height of 14m was assumed for all stands not already exceeding this threshold. Softwood basal area was then calculated from the forecasted heights, crown closures and volumes. More detailed information regarding forecasting techniques and equations can be found here: novascotia.ca/natr/wildlife/habitats/terrestrial/pdf/SMP_American_Marten.pdf |
|
Marten Range Patches 2030 |
Within the Marten Habitat Management Zone (MHMZ), forecasting forest development on a stand-by-stand until year 2030 produced a series of marten habitat map layers for 2004, 2009, 2014, 2019, and 2030 used to identify and plan for 55 prescribed marten home range patches by 2030. While not all of the required patches were initially available within the MHMZ, particularly in the first 3 time periods, by the year 2030 the options to create quality marten habitat patches will increase significantly if the Special Management Practices (SMPs) are adhered to. Home range patches may migrate within the MHMZ but must be a minimum 500 ha in size, circular in shape, and contain a minimum 60% marten habitat. There were an additional 25 patches forecasted for the year 2019
Stand volumes were grown according to the Department of Natural Resources forest inventory site classification system used in Nova Scotia. Stand heights were forecasted based the site class of the stand, and a maximum height of 14m was assumed for all stands not already exceeding this threshold. Softwood basal area was then calculated from the forecasted heights, crown closures and volumes. More detailed information regarding forecasting techniques and equations can be found here: novascotia.ca/natr/wildlife/habitats/terrestrial/pdf/SMP_American_Marten.pdf |
|
Marten Habitat Management Zone |
American Marten (Martes americana) is provincially listed as an endangered species under the Nova Scotia Endangered Species Act due to their small population size and limited localized occurrence. Historically, marten were found throughout Nova Scotia but are now found, in low numbers, in only two locations. There is a re-introduced population in southwestern Nova Scotia and a small relict population on Cape Breton Island (CBI). The distribution of the present population is highly fragmented with a small subpopulation on the northwest side of the highlands, largely inside the boundaries of the Cape Breton Highlands National Park, and a second sub-population in the southeastern highlands. Remaining marten habitat remains fragmented and under threat of harvesting
The Marten Recovery Team has defined a Marten Habitat Management Zone (MHMZ) derived from modeling and local experience to restore a self-sustaining population of the Cape Breton marten. Special management practices that were developed for the marten’s recovery apply to areas within this zone. More information can be found here: novascotia.ca/natr/wildlife/habitats/terrestrial/pdf/SMP_American_Marten.pdf |
|
Cape Breton Island Lynx Range |
This dataset represents the lynx core habitat in Nova Scotia. The largest area of contiguous lynx habitat is the Cape Breton Taiga and Cape Breton Highlands Ecodistricts, but knowledge suggests that concentrations of lynx also occur in areas of the Cape Breton Hills Ecodistrict such as Boisdale Hills, East Bay Hills, The Big Ridge, South Cape Highlands, North Mountain, and South Mountain. The lynx habitat range was mapped by the local regional biologists and then modified several years later by the Lynx Recovery team. It was based on lynx sightings and records, ecological land classifications, and elevation restrictions. More information can be found here: novascotia.ca/natr/wildlife/habitats/terrestrial/pdf/SMP_Canada_Lynx.pdf |
|
Mainland Moose Concentration Areas |
The Nova Scotia mainland population of moose (Alces alces americana) was listed as endangered in 2003. (Moose on Cape Breton Island are not risk as they are abundant and the result of a re-introduction of moose from Alberta in the 1940's.) Endangered mainland moose special management practices were developed for application at the provincial scale. As part of this process moose significant population concentration areas on the mainland were identified. Moose Special Management Practice will be applied within the five Significant Mainland Moose Population Concentration areas mapped by NSDNR, Wildlife Division in February 2012.
Moose population concentration areas were identified using a scientifically-based geographic model, expert review, and the best available data. The model included an estimate of total occupied range, relative population density, and significant population concentration areas. It was developed using 3272 moose observational records (includes animal sightings, pellets, tracks, and other reliable moose signs) compiled between 1999 and 2011. Additional information on the Mainland Moose Special Management Practices can be found here: novascotia.ca/natr/wildlife/habitats/terrestrial/pdf/SMP_Mainland_Moose.pdf. |
|
Significant Habitat |
Significant habitats include: · sites where species at risk or other species of conservation concern can be found · sites where unusually large concentrations of wildlife occur · habitat that are rare in the province. The Significant Habitat polygons are classified as species at risk, species of concern, deer wintering, moose wintering (only used in Cape Breton), migratory bird, and other habitat. This dataset consists of polygons and not exact species locations. This data is not the results of a thorough survey and should not be considered a list of all the significant habitats in Nova Scotia. More information on the Significant Species and Habitats Database can be found here: novascotia.ca/natr/wildlife/habitats/hab-data/ |
Search
|
|
|
The Search widget is the “magnifying glass” icon in the left widget toolbar. |
Search by Value |
|
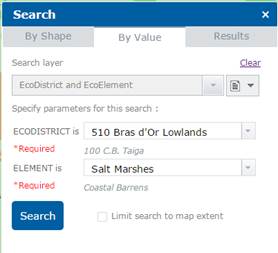
When the Search widget is clicked, the search window at left is displayed and will open to the “By Value” option.
The Search layer drop down list includes all the map layers that can be searched. Searchable layers include: 1. EcoDistrict and EcoElement 2. EcoDistrict and EcoSection 3. Wetlands 4. Vegetation 5. Property
Depending on the layer selected, different search parameters can be entered below. The example at left shows the parameters for the “EcoDistrict and EcoElement” search.
If you check the box “Limit search to map extent”, the search will be limited to the area currently displayed on screen. |
|
|
|
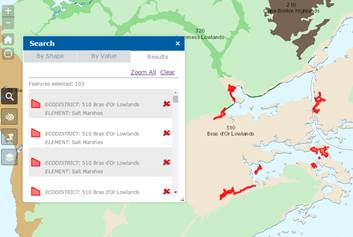
When the search completes, a list of the results will be displayed in the Results tab of the Search window and the selected features will be outlined in red on the map.
If you click on any result in the Search window, the map will zoom to the corresponding feature on the map. Click “Zoom All” to return the map to the full extent that displays all search results.
If you click
the |
Search by Shape |
|
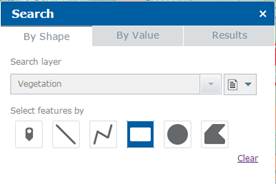
The search “By Shape” method allows you to find information on a selected layer by drawing a spatial graphic.
Select a layer from the “Search layer” drop down list.
Under “Select features by”, choose a search option. The options are point, line, polyline, rectangle, circle or polygon. |
|
|
|
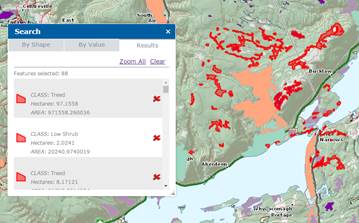
Click on the map to draw the search shape or point (in this example, we’ve drawn a rectangle).
|
|
|
|
When the search completes, all features that touch or fall within your search shape will be outlined in red on the map. A list of the results will also be displayed in the Results tab of the Search window.
If you click on any result in the Search window, the map will zoom to the corresponding feature on the map. Click “Zoom All” to return the map to the full extent that displays all search results. If you click the |

Draw and Measure |
|
|||
|
|
|
The Draw and Measure widget allows the user to place graphics, text and measurement information on the map face prior to printing. It provides basic "sketching” and “redlining" functions to mark up the map.
When the widget is initially opened, the user is presented with the following 11 drawing tools. From left to right, they are: Point, Line, Polyline, Freehand line, Triangle, Rectangle, Circle, Ellipse, Polygon, Freehand polygon, Text
Once you select a drawing tool (e.g. Line), choose a Colour, Line Style, Transparency and Width. A Preview of the options you selected will be displayed at the top of the window. If you would like to include measurements for the feature you draw on the map, select Show Measurements.
Click and drag your mouse on the map to start drawing the line, rectangle, etc. Let go of your mouse button to finish drawing the feature. You can add multiple shapes and text to the map before you print it.
|
|
|

Locate by Address or Coordinates |
|
|
|
|
|
|
|
|
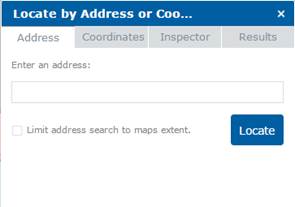
The dialogue will present the user with two methods for finding a location: Address or Coordinates.
Locate by Address will allow the user to enter a civic address to be located. When the Search button in clicked, the site will reorient itself to the new location.
|
|
|
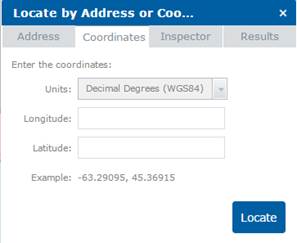
By Coordinates |
|
Locate by Coordinates will allow the user to select the units (e.g. decimal degrees, Lat/Long, etc.), then enter a set of coordinate values. When the Locate button is clicked, the map will reorient to display the location. |
|
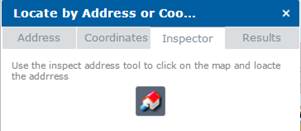
Inspector |
|
The Inspector tool allows the user to click on any civic addressed point on the map and display the full civic address information. The map will be zoomed in to show the location selected. |
Top Widget Toolbar
Legend |
|
|
|
|
|
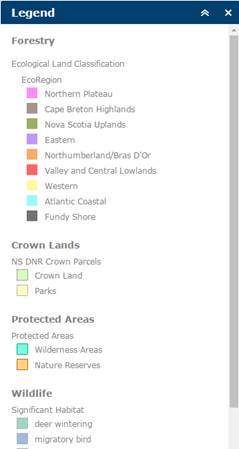
The Legend describes what each colour or symbol on the map represents.
Some layers are scale dependant and will turn on or off, depending on the display scale of the map. The items shown in the Legend will change as the map scale changes, with more layers becoming visible as you zoom in, less as you zoom out.
Use the scroll bar on the right side of the Legend to move up or down and see the full list of layers and items in the Legend.
|
Bookmarks |
|
|
|
|
|
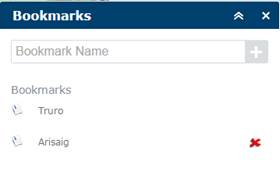
Bookmarks will allow you to name and save a specific location on the map. When you enter a Bookmark Name (in this example, Arisaig) and click the (+) symbol, the bookmark will be added to the list for the current map location. Click the bookmark name again and the map will zoom to that map location.
You can
remove any bookmark you have added by clicking the |
Basemap Gallery |
|
|
||
|
|
|
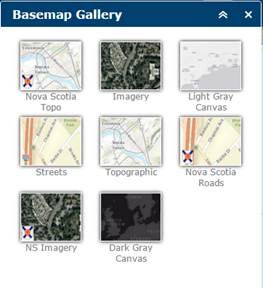
Choose between various base maps. The most commonly used base maps are: Topographic, Imagery and Roads/Streets.
Topographic will present the user with a detailed topographic map behind the DNR data. The topographic mapping will increase and decrease in level of detail as the user changes the zoom levels.
The NS Topographic base map is maintained by the NS Geomatics Centre and has a greater level of detail than the Topographic base map, which is maintained by ESRI.
Imagery will present the user with air photo satellite imagery behind the DNR data. The level of detail varies in different locations, with urban areas having higher detailed photography.
Two different imagery base maps are available: NS Imagery is maintained by the NS Geomatics Centre. The other Imagery service is maintained by ESRI, separate from the provincial data.
Streets is a comprehensive street map that include highways, major roads, minor roads, direction indicators, water features, cities, parks and landmarks. This base layer is maintained by ESRI. |
||
|
|
|
|
|
|
|
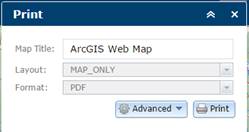
This feature allows the user to print a map with all the information displayed on the screen.
The Layout drop down list allows you to select from various page layout options (e.g. Letter or Tabloid page size, Portrait or Landscape, etc.). The Format drop down list allows you to select from various output file formats such as PDF, JPG, GIF, or EPS.
The Advanced button allows you to set additional features such as the map size, print quality, or include a legend. |
|
|
|
|
Add a Map Service |
|
|
|
|
|
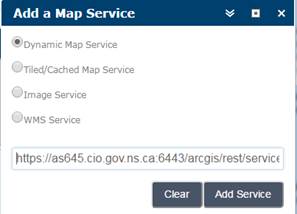
The Add a Map Service button allows you to add a map service into the viewer and display the data on the map along with the DNR data.
Enter, or copy and paste the URL of the web service in the URL field.
Click the Add Service button and the new layer will be displayed on the map. The layer name will also appear in the Layer List and as for other layers, can be turned off or on by clicking the check box next to the layer.
Please note that Feature Services cannot be added to the viewer. Only Map Services can be used. |
Add a Shapefile |
|
|
|
|
|
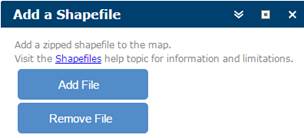
Add a Shapefile allows the user to upload an ESRI shapefile and display the data on the map.
The Add a Shapefile window is shown at left. Click ‘Add File’ to open a dialogue to locate and select the zipped shapefile on your computer. Once selected, the shapefile will be uploaded, symbolized and displayed on the map.
Please note: The size limit for an uploaded shapefile is 1000 features or 10MB. For more information, click here: http://doc.arcgis.com/en/arcgis-online/reference/shapefiles.htm
|